Back to Projects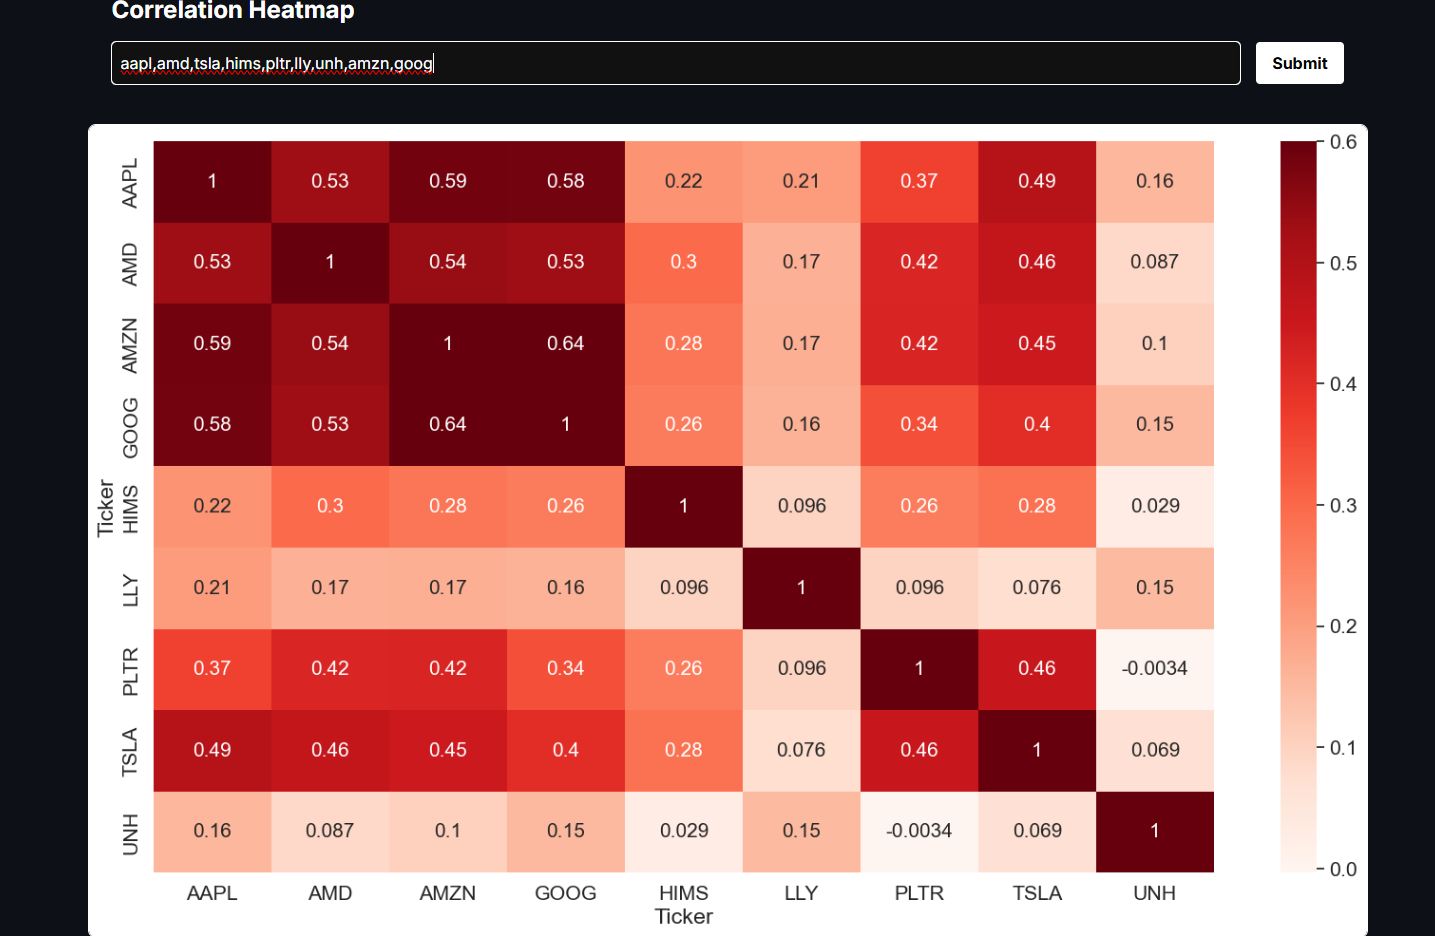
Stocks Correlation Heatmap
PythonFlaskReactTypeScriptyFinance
About
This tool visualizes how closely different stocks move together by computing a correlation heatmap of daily returns. On submit, the frontend sends a list of tickers to a Next.js API route, which launches a Python worker using yfinance, pandas, NumPy, seaborn, and matplotlib. The worker downloads historical close prices, converts them to daily percentage returns, calculates the pairwise correlation matrix, and renders a labeled heatmap (with a capped color scale for readability). The plot is encoded as base64 and returned to the browser, so no files are written or hosted. This backend-driven approach keeps the app stateless and fast, and the resulting heatmap helps users quickly spot clusters that move together (high positive correlation) versus potential diversifiers (low or near-zero correlation) for portfolio construction and risk management.
Gallery