Back to Projects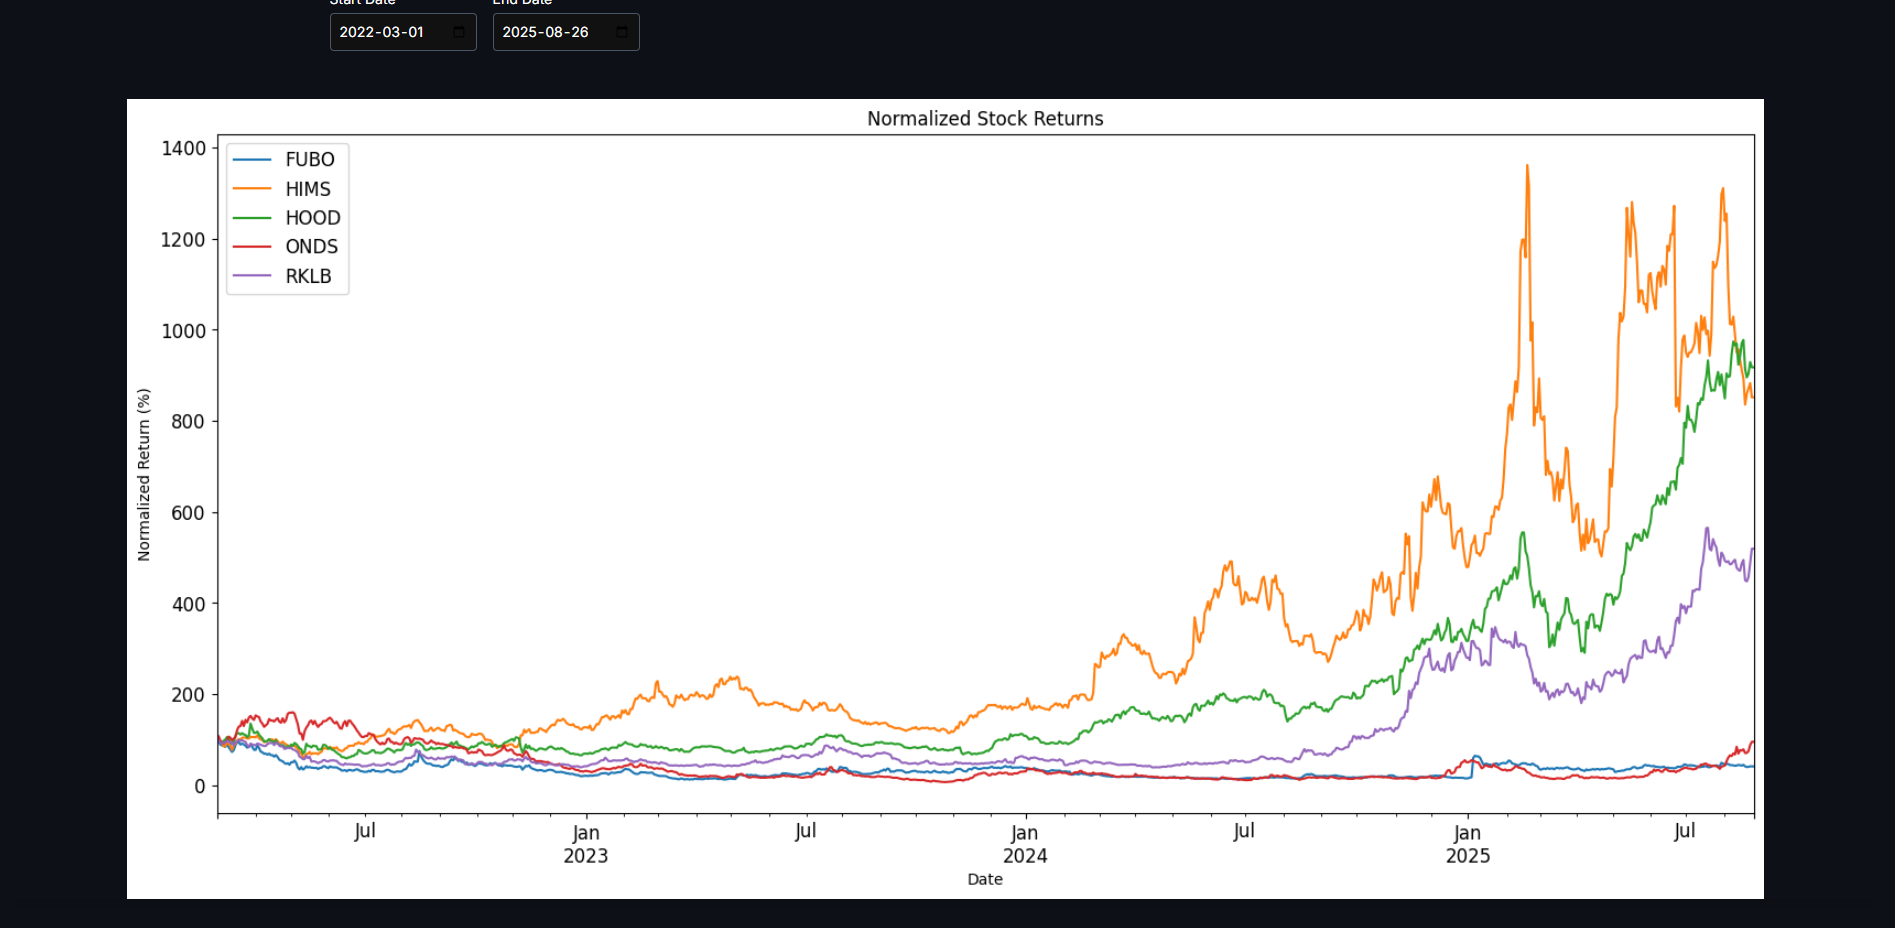
Normalized Stock Return Comparison Chart
PythonFlaskReactTypeScriptyFinance
About
A quantitative analysis tool that compares the performance of multiple stocks over a given time period by normalizing their returns. The system fetches historical price data from Yahoo Finance, aligns trading dates across tickers, and scales each stock to start at the same baseline (100%). This allows for a clear, apples-to-apples comparison of how different equities perform relative to one another. The project includes automated data cleaning, normalization, and visualization, with results dynamically rendered in the web interface.
Gallery